
Data Visualization
Powerful Insights In Just A Few Clicks
-
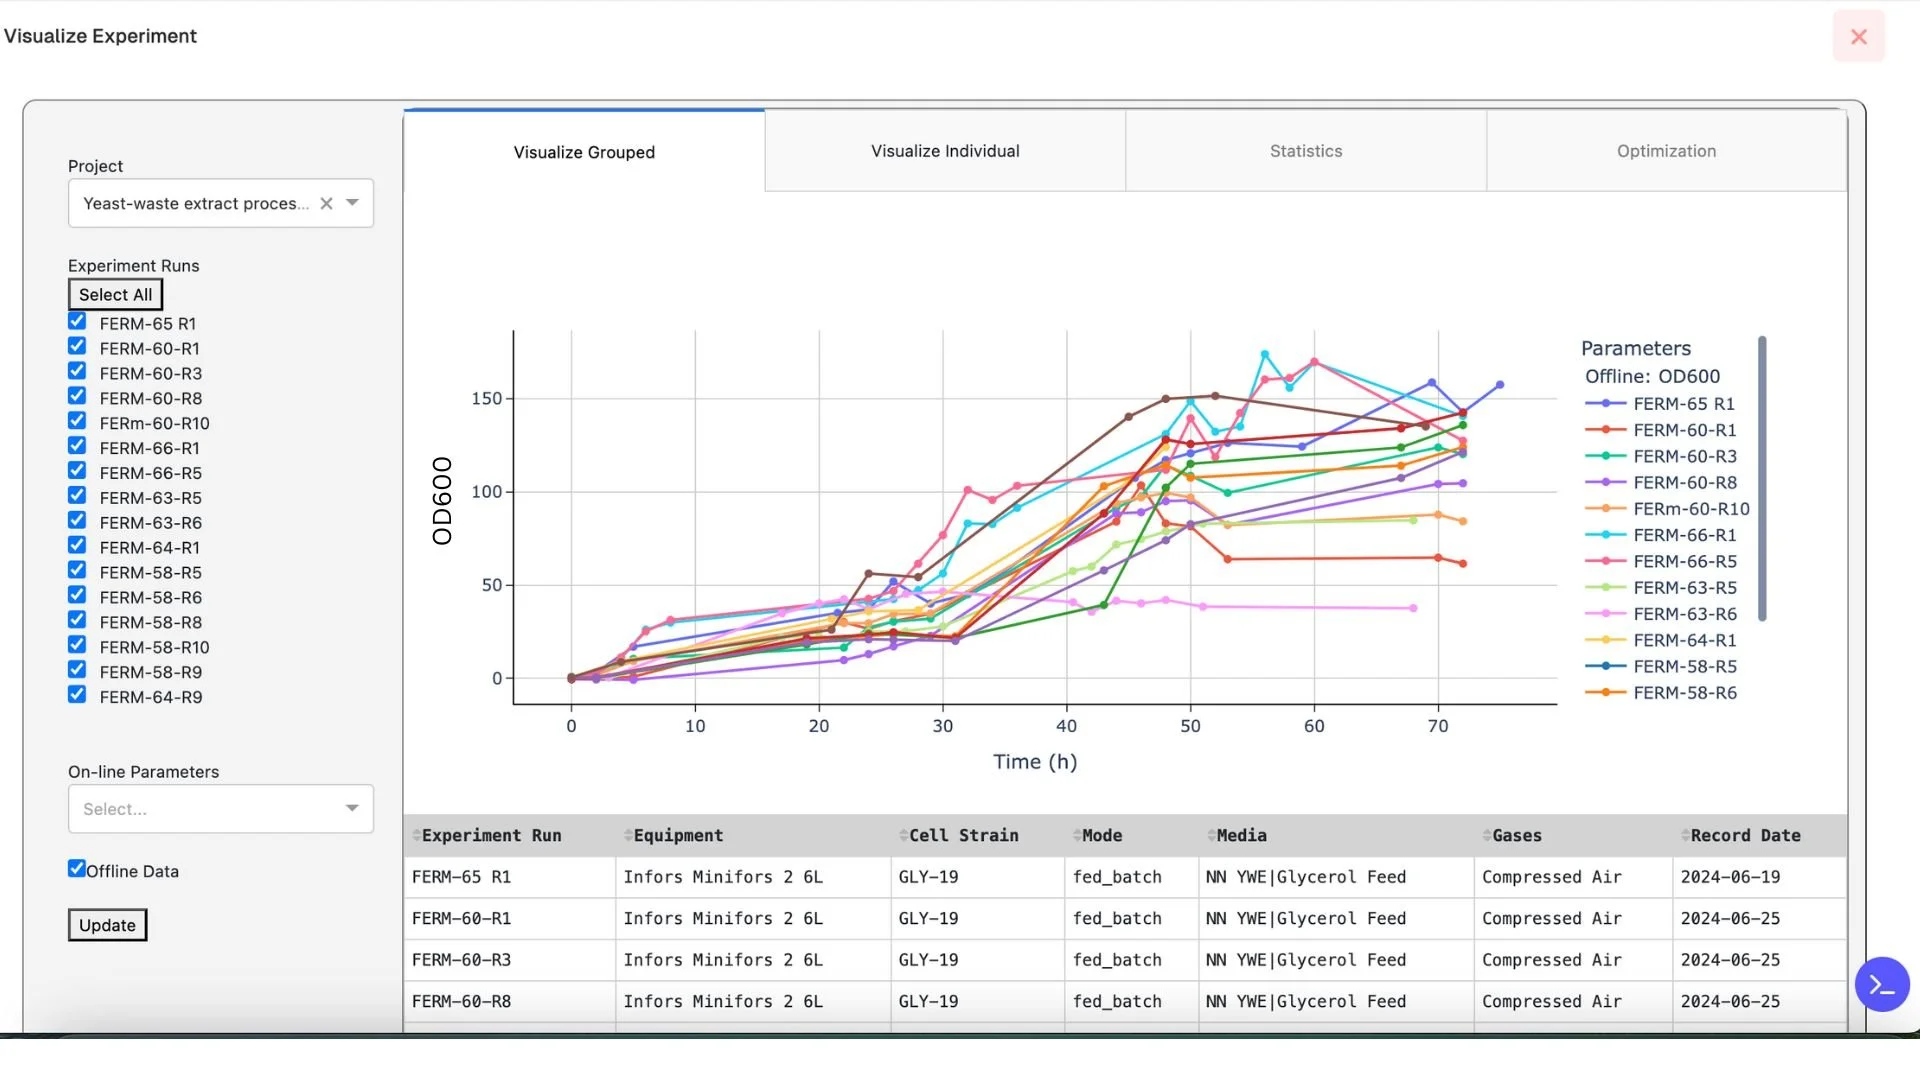
Data Overlay
BioReact’s powerful visualization tools let scientists view and compare data across different bioreactor scales, conditions, or timepoints—all in one place. Users can overlay online and offline data from multiple experiments or drill down into individual runs to uncover hidden trends. With intuitive graphing and side-by-side comparisons, BioReact makes it easy to extract insights and accelerate decision-making.
-
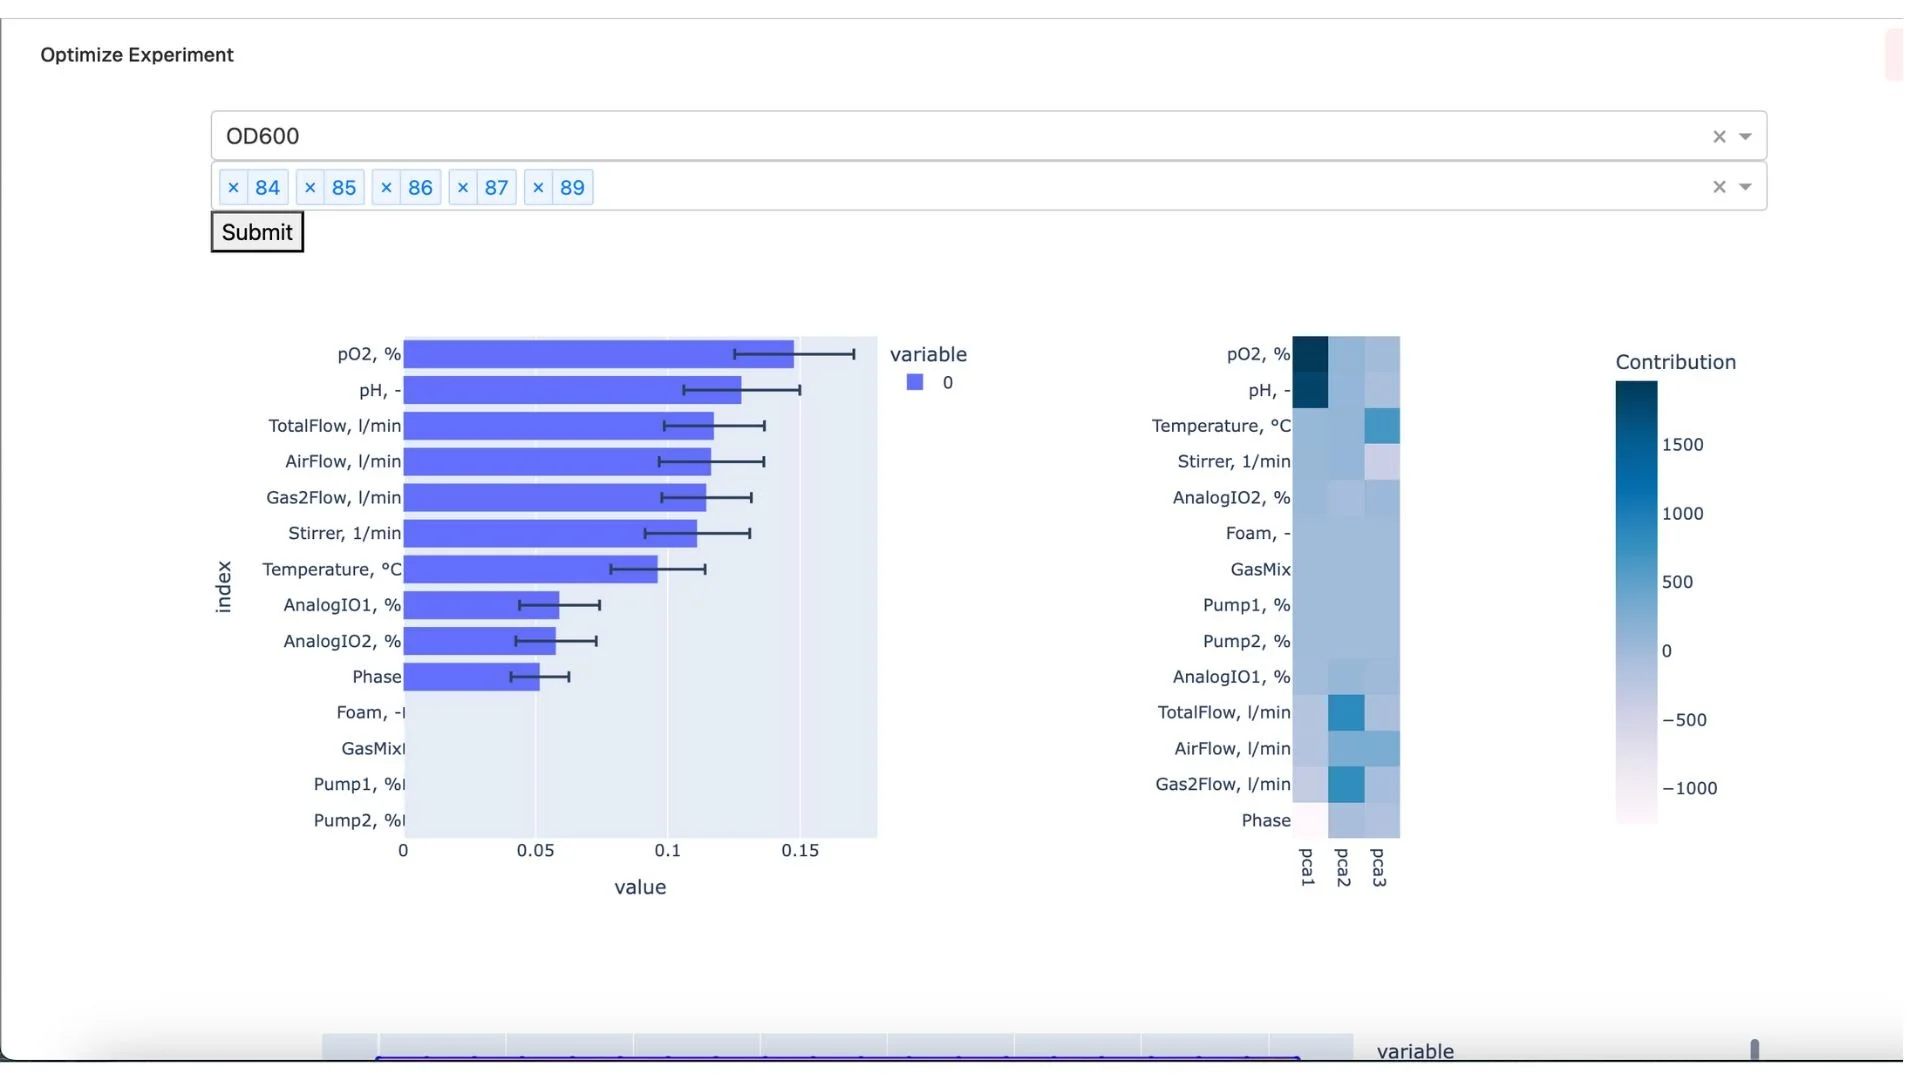
Factor Importance & Heatmaps
BioReact’s heatmaps and factor importance tools help scientists quickly identify which variables have the greatest impact on cell growth, yield, or viability. By visualizing trends across experiments and highlighting statistically significant parameters, users can focus on what truly drives performance. Our AI-powered insights make it easy to prioritize the next steps in process optimization—without needing advanced analytics expertise.
